INP is one of the Core Web Vitals metrics, replacing FID. It factors the user experience throughout the page lifecycle.
Is INP important? It has been found to have a direct relation with conversion rates, the worse the INP the more conversion rates tend to suffer. This relation has no consistent correlation with Google’s “good”, “needs improvement”, and “poor” thresholds.
INP also counts towards the Page Experience, which means if you’re failing it, your whole Core Web Vitals will be counted as failing, for Google SEO purposes.
Why improve your Core Web Vitals (guide)
What is Interaction to Next Paint (INP)
INP measures the time of each click, tap, or keypress on the page until the next update to the screen. Most of the work on INP will be on mobile, as it has less processing power than desktop. INP is also considered the most difficult metric to optimize.
The threshold for INP to measure is the 75th percentile of page loads recorded in the field, segmented across mobile and desktop, with the following range:
- An INP below or at 200 milliseconds means that your page has good responsiveness.
- An INP at <200ms and below or at 500 milliseconds means needs improvement.
- An INP <500 milliseconds means that your page is in poor range.

How to check INP
Always check for Core Web Vitals field data or strive for metrics from live users.
To get categorized INP data use RumVision. It offers the LOAF API for INP, which directly categorizes what third party is causing the INP.

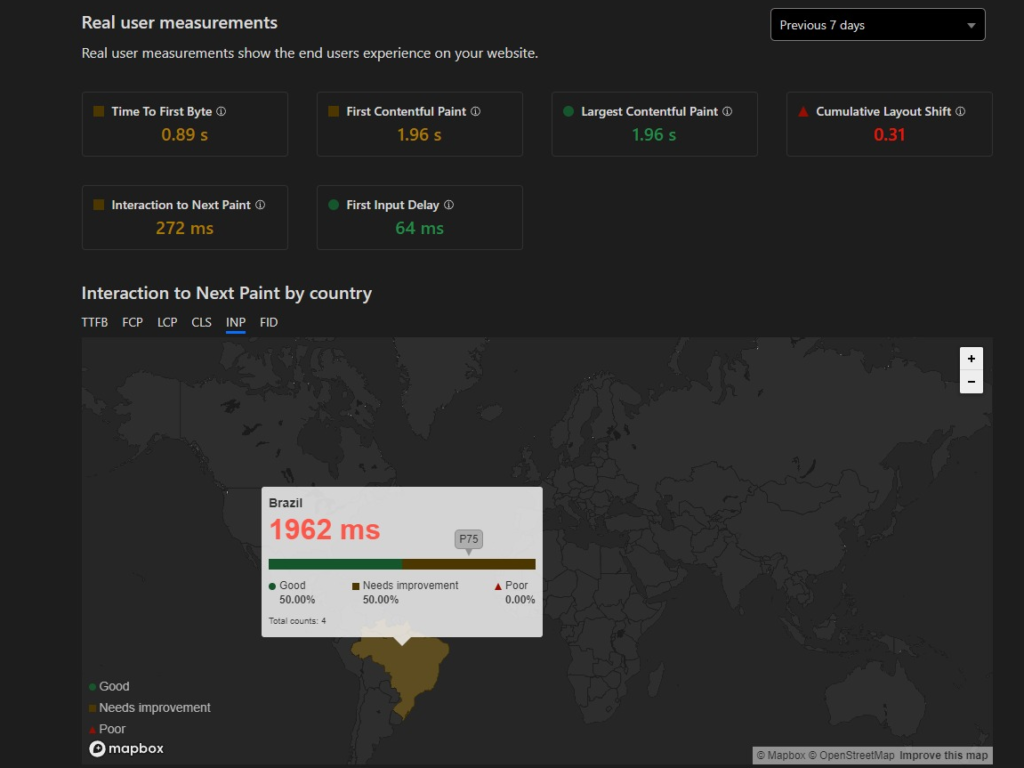
Cloudflare also offers free INP data, but not categorized. You can find it on the Observatory tab under the Speed Category on Cloudflare.
Enable the free Real user monitoring (RUM), add a URL(data is segmented by URL), and wait for results. You need to have Cloudflare Web Analytics enabled(guide) to get RUM data.

INP lab data
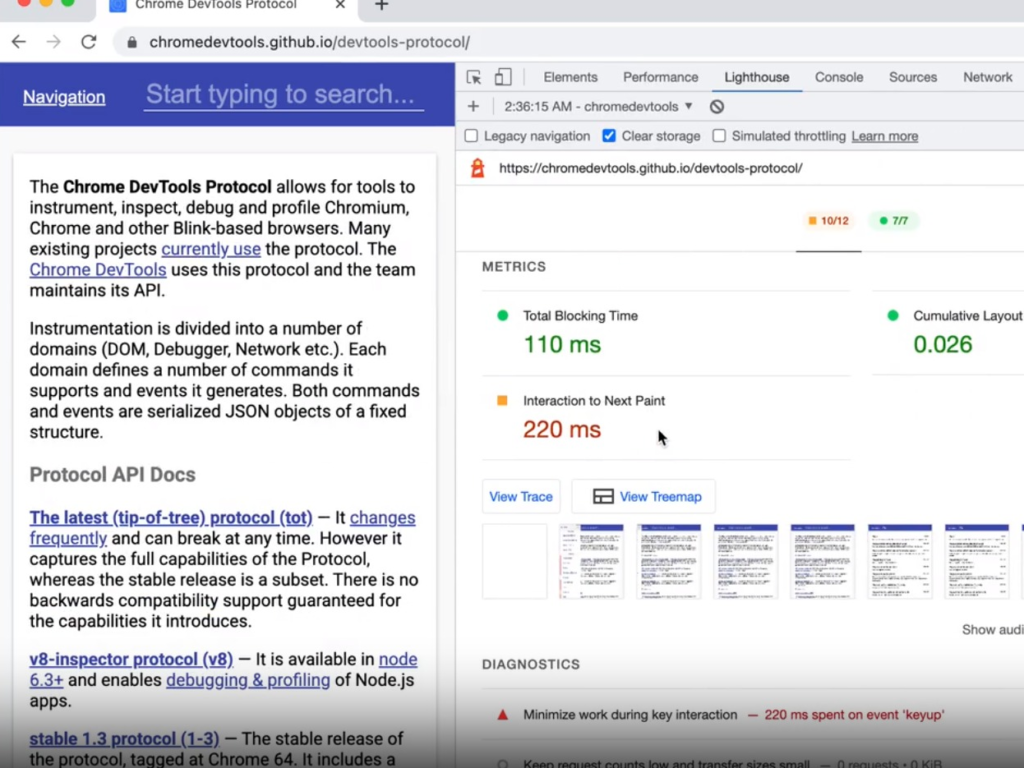
Use Lighthouse’s Timespan mode to check INP lab data. It allows to analyze an arbitrary period of time and emulate user interaction.

You can also test INP locally with the Web Vitals extension.
When testing INP lab data locally, follow this workflow to have closer results to field data:
- Emulate Mobile
- Throttle the CPU to mobile (x4, x6 slowdown)
- Accept cookies
Some of these can be emulated in the Chrome Performance tab. When checking lab or field data, you may also prioritize testing INP on high-traffic pages and with most conversions.
How to improve INP in WordPress
Choose plugins and theme features wisely
Themes that offer many functions bundled may have unoptimized code that will make your INP be in the above 200ms range by default, failing the metric.
Plugin features can also lead to worse INP as they may add additional JS. Use a RUM tool such as RumVision that tracks which 3rd-party tools are degrading your INP.
Run third-party scripts off the main thread in Web workers
You can run third-party scripts on web workers with Partytown, or Zaraz(Cloudflare Edge). They are improving support for more APIs, making it able to run not just pageviews triggers from analytics tools, but much more popular analytic metrics.
Choose Iframes wisely
Due to the content security policy on iframes, recording INP on them is forbidden. Select carefully what iframes you will use.
Test disabling the Delay JS feature
The Delay Javascript feature was a tool meant to improve Pagespeed, as Total Blocking Time(TBT) still has 30% of the total scoring.
But as Core Web Vitals matures, you can test disabling this feature. You can improve your INP by 34% just with this optimization.
Go to your speed optimization plugin and disable the feature. Check your INP a few days later and see the results.
With INP replacing FID, new techniques to load Javascript may be necessary to avoid having a bad INP, including import on interaction(not to be confused with delay until user interaction).
Get an INP metric consulting/optimization


